
Summary
Due to occasional train faults and poor knowledge of the best routes, students often spend longer times travelling to school. Another issue is that students who are new to Singapore may not be aware of amenities which are available in their immediate vicinity. The objectives of this project are to help optimise travel times for NUS students and provide helpful information about facilities near their home or travel routes.
Data Source
We obtained data from these sources:
- Moves & OpenPaths
- Twitter API (Tweets on Reports of Train Disruptions, from SMRT’s Official Account)
- Yelp API (Ratings of Restaurants)
- Data.gov.sg (Shopping Mall & Hawker Centre Data)
Analysis
Heatmaps, cluster maps and Anselin’s Local Moran’s I for Local Spatial Autocorrelation were used to analyze the students' behaviour with their movement data.
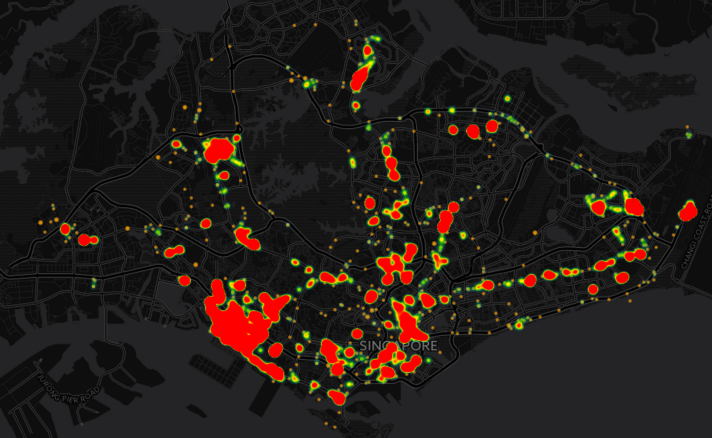
HeatMap
The heatmap shows the frequently travelled paths of the students. One very visible hotspot is the area around NUS, at the southwest part of Singapore.
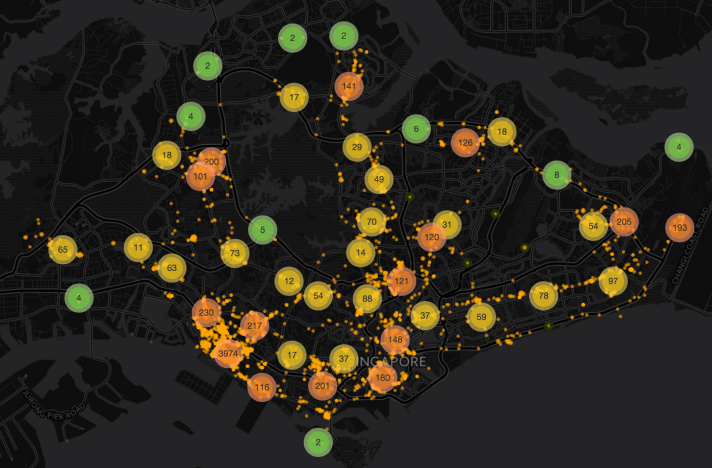
Cluster Maps
This cluster map shows all the clusters formed and also serves as heatmap. Visit the interactive Shiny application to view the distribution within the clusters by clicking on each cluster.
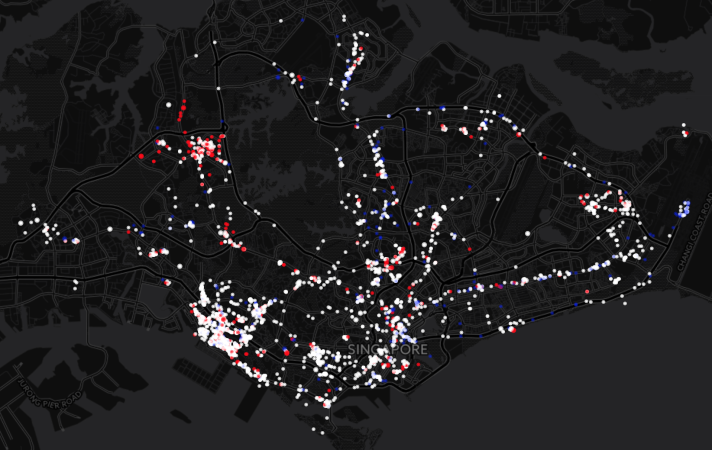
Anselin’s Local Moran’s I
With Anselin’s Local Moran’s I Index we can tell the time spent by the students at each location, as compared to their neighbours. Red points are high-high points, which tell us that these students spend a longer duration, as compared to their neighbours and that there is a high concentration of these students in this particular location. Blue points are low-low points and signify the contrary.
Application
After analyzing the movement pattern of NUS students, we made an attempt to address our objectives, by examining the impact of train faults on students’ travel plans and also to propose useful information on nearby amenities.
Train Faults
By plotting the lines where the disruptions have occurred, we can see which line is the most prone to train faults (in the past 2 years). We have also identified that train disruptions usually occur on Mondays and Thursdays. Although it is not practical to avoid travelling on those days, we advise that students be prepared for an increased probability of incidents or chose an alternate route.
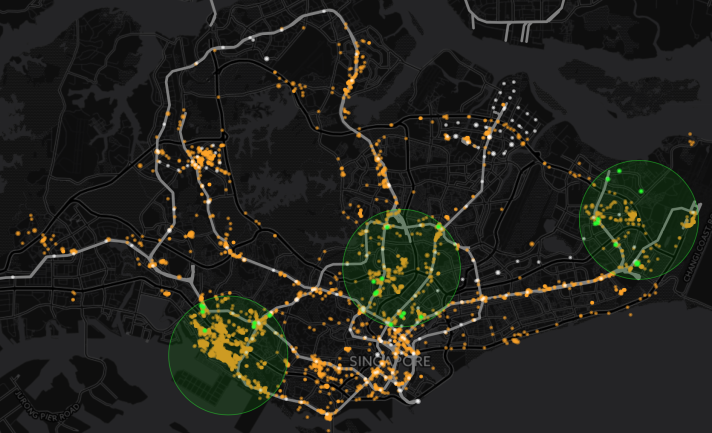
Shopping Malls
Using medoid clustering to determine the centres of the clusters of students’ movements, we created a geofence with 3 km radius from the centre to highlight which shopping malls are closest to these clusters. As shown in the image below, we identified 3 main clusters– around NUS, CBD and one far east. There are not many shopping malls in these clusters, as these clusters are residential areas. We have also provided customer rating of these malls (extracted from yelp).
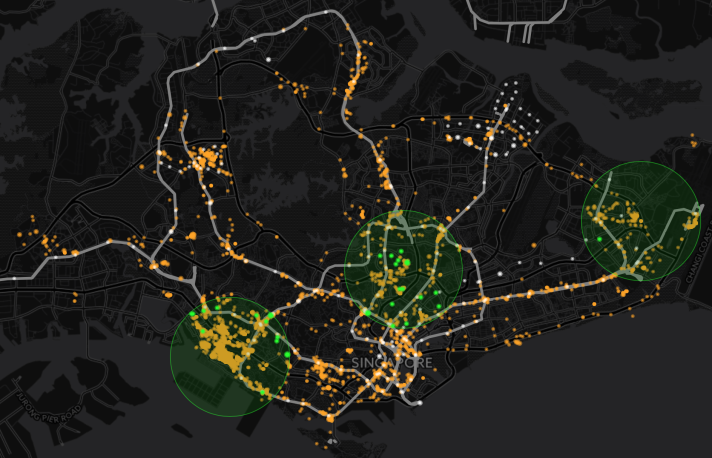
Hawker Centres
Hawker centres, on the other hand, tell a different story. There are an abundance and relatively equal distribution of hawker centres within the clusters. The government has made a conscientious effort to ensure that affordable food is available within a walking distance, to all residing in these residential districts. Customer ratings for these hawker centres are available too.
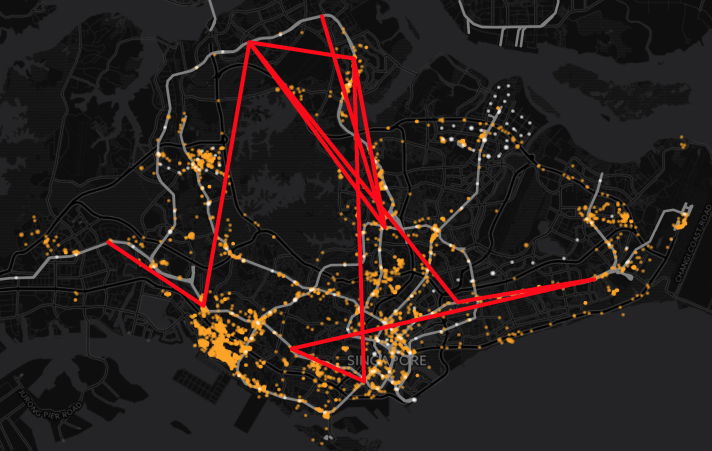
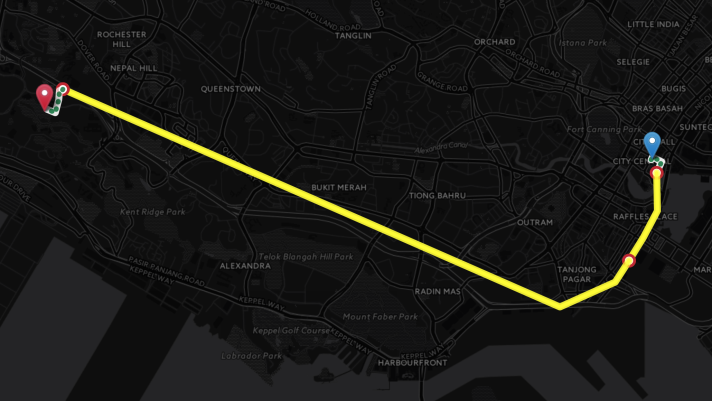
Proposal of Alternative Travelling Route
We have attempted to propose an alternate route in the event of a train disruption, from Raffles Place to NUS ISS. As this route planning algorithm is in its infancy, we have only proposed this one alternative, which is only possible via car/taxi.
Conclusion
In this project, we achieved our objectives of proposing alternative routes and helping students plan their travel routes better in the event of train disruptions, as well as suggesting helpful information on nearby amenities.